Understanding Confusion Matrix
When we get the data, after data cleaning, pre-processing and wrangling, the first step we do is to feed it to an outstanding model and of course, get output in probabilities. But how can we measure the effectiveness of our model? Better the effectiveness, better the performance and that’s what we want. And it is where the Confusion matrix comes into the limelight. Confusion Matrix is a performance measurement for machine learning classification.
There are multiple ways of finding errors in the machine learning model. The Mean Absolute Error(Error/cost) function helps the model to be trained in the correct direction by trying to make the distance between the Actual and predicted value to be 0. We find the error in machine learning model prediction by “y — y^”.
Mean Square Error(MSE): Points from the data set are taken and they are squared first and then the mean is taken to overcome the error.
In Binary Classification models, the error is detected with the help of confusion matrix.
Confusion Matrix is a performance measurement for machine learning classification problem where output can be two or more classes. It is a table with 4 different combinations of predicted and actual values.

It is extremely useful for measuring Recall, Precision, Specificity, Accuracy and most importantly AUC-ROC Curve.
Four outcomes of the confusion matrix
The confusion matrix visualizes the accuracy of a classifier by comparing the actual and predicted classes. The binary confusion matrix is composed of squares:

- TP: True Positive: Predicted values correctly predicted as actual positive
- FP: Predicted values incorrectly predicted an actual positive. i.e., Negative values predicted as positive. Also known as the Type 1 error
- FN: False Negative: Positive values predicted as negative. Also known as the Type 2 error
- TN: True Negative: Predicted values correctly predicted as an actual negative
The accuracy of a model (through a confusion matrix) is calculated using the given formula below.
Accuracy = TN+TP / TN+FP+FN+TP

Accuracy can be misleading if used with imbalanced datasets, and therefore there are other metrics based on confusion matrix which can be useful for evaluating performance. In Python, confusion matrix can be obtained using “confusion_matrix()” function which is a part of “sklearn” library. This function can be imported into Python using “from sklearn.metrics import confusion_matrix.” To obtain confusion matrix, users need to provide actual values and predicted values to the function.
Why Do We Need a Confusion Matrix?
Before we answer this question, let’s think about a hypothetical classification problem.
Let’s say you want to predict how many people are infected with a contagious virus in times before they show the symptoms, and isolate them from the healthy population (ringing any bells, yet?). The two values for our target variable would be: Sick and Not Sick.
Now, you must be wondering — why do we need a confusion matrix when we have our all-weather friend — Accuracy? Well, let’s see where accuracy falters.
Our dataset is an example of an imbalanced dataset. There are 947 data points for the negative class and 3 data points for the positive class. This is how we’ll calculate the accuracy:

Let’s see how our model performed:

The total outcome values are:
TP = 30, TN = 930, FP = 30, FN = 10
So, the accuracy for our model turns out to be:

96%! Not bad!
But it is giving the wrong idea about the result. Think about it.
Our model is saying “I can predict sick people 96% of the time”. However, it is doing the opposite. It is predicting the people who will not get sick with 96% accuracy while the sick are spreading the virus!
Do you think this is a correct metric for our model given the seriousness of the issue? Shouldn’t we be measuring how many positive cases we can predict correctly to arrest the spread of the contagious virus? Or maybe, out of the correctly predicted cases, how many are positive cases to check the reliability of our model?
Case study:
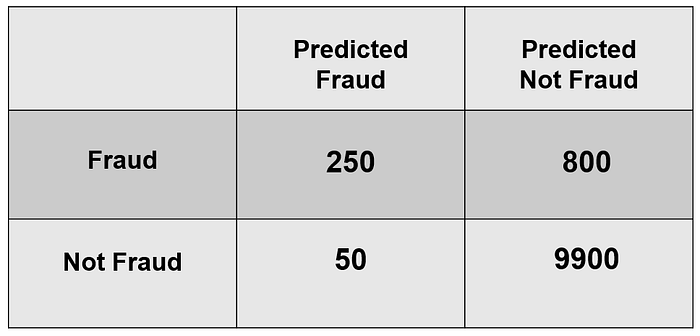
We are tasked with building a classifier that predicts fraudulent or non fraudulent for different transactions. The data was handed to us by a major bank in the UK with very tight security — the personal details of all customers were encrypted for privacy concerns — so fraudulent transactions do not happen very often. In fact, the data that they had given us had 10,000 negative cases (non-fraudulent) and 1000 (fraud) cases. Figure 5 shows the results of our classifier.